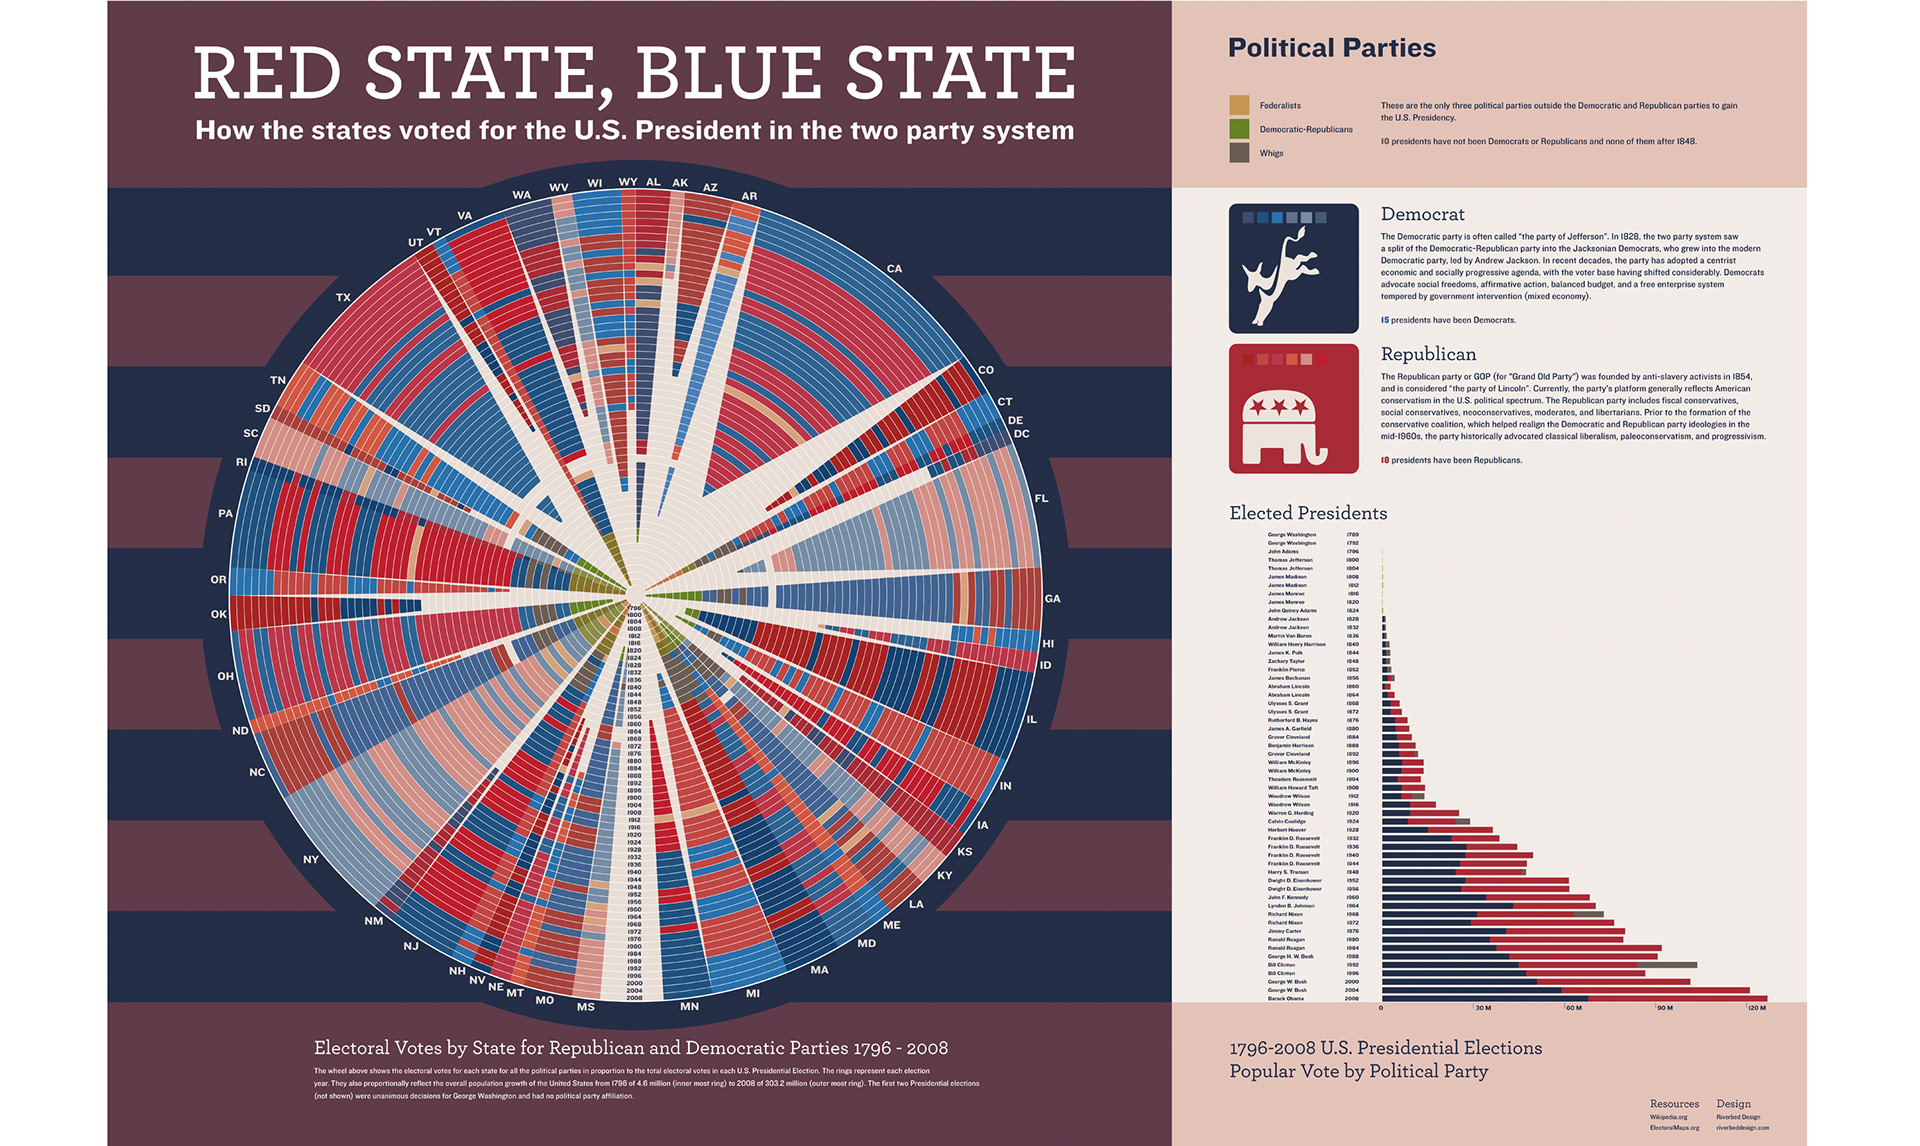
How the states voted for U.S. President in the two party system
Electoral Votes by State for Republican and Democratic Parties 1796 - 2008
Electoral Votes by State for Republican and Democratic Parties 1796 - 2008
The wheel shows the electoral votes for each state for all the political parties in proportion to the total electoral votes in each U.S. Presidential Election. The rings represent each election year. They also proportionally reflect the overall population growth of the United States from 1796 of 4.6 million (innermost ring) to 2008 of 303.2 million (outermost ring). The first two Presidential elections (not shown) were unanimous decisions for George Washington and had no political party affiliation.
The Washington Post featured this infographic. You can see the article here.